Dashboard
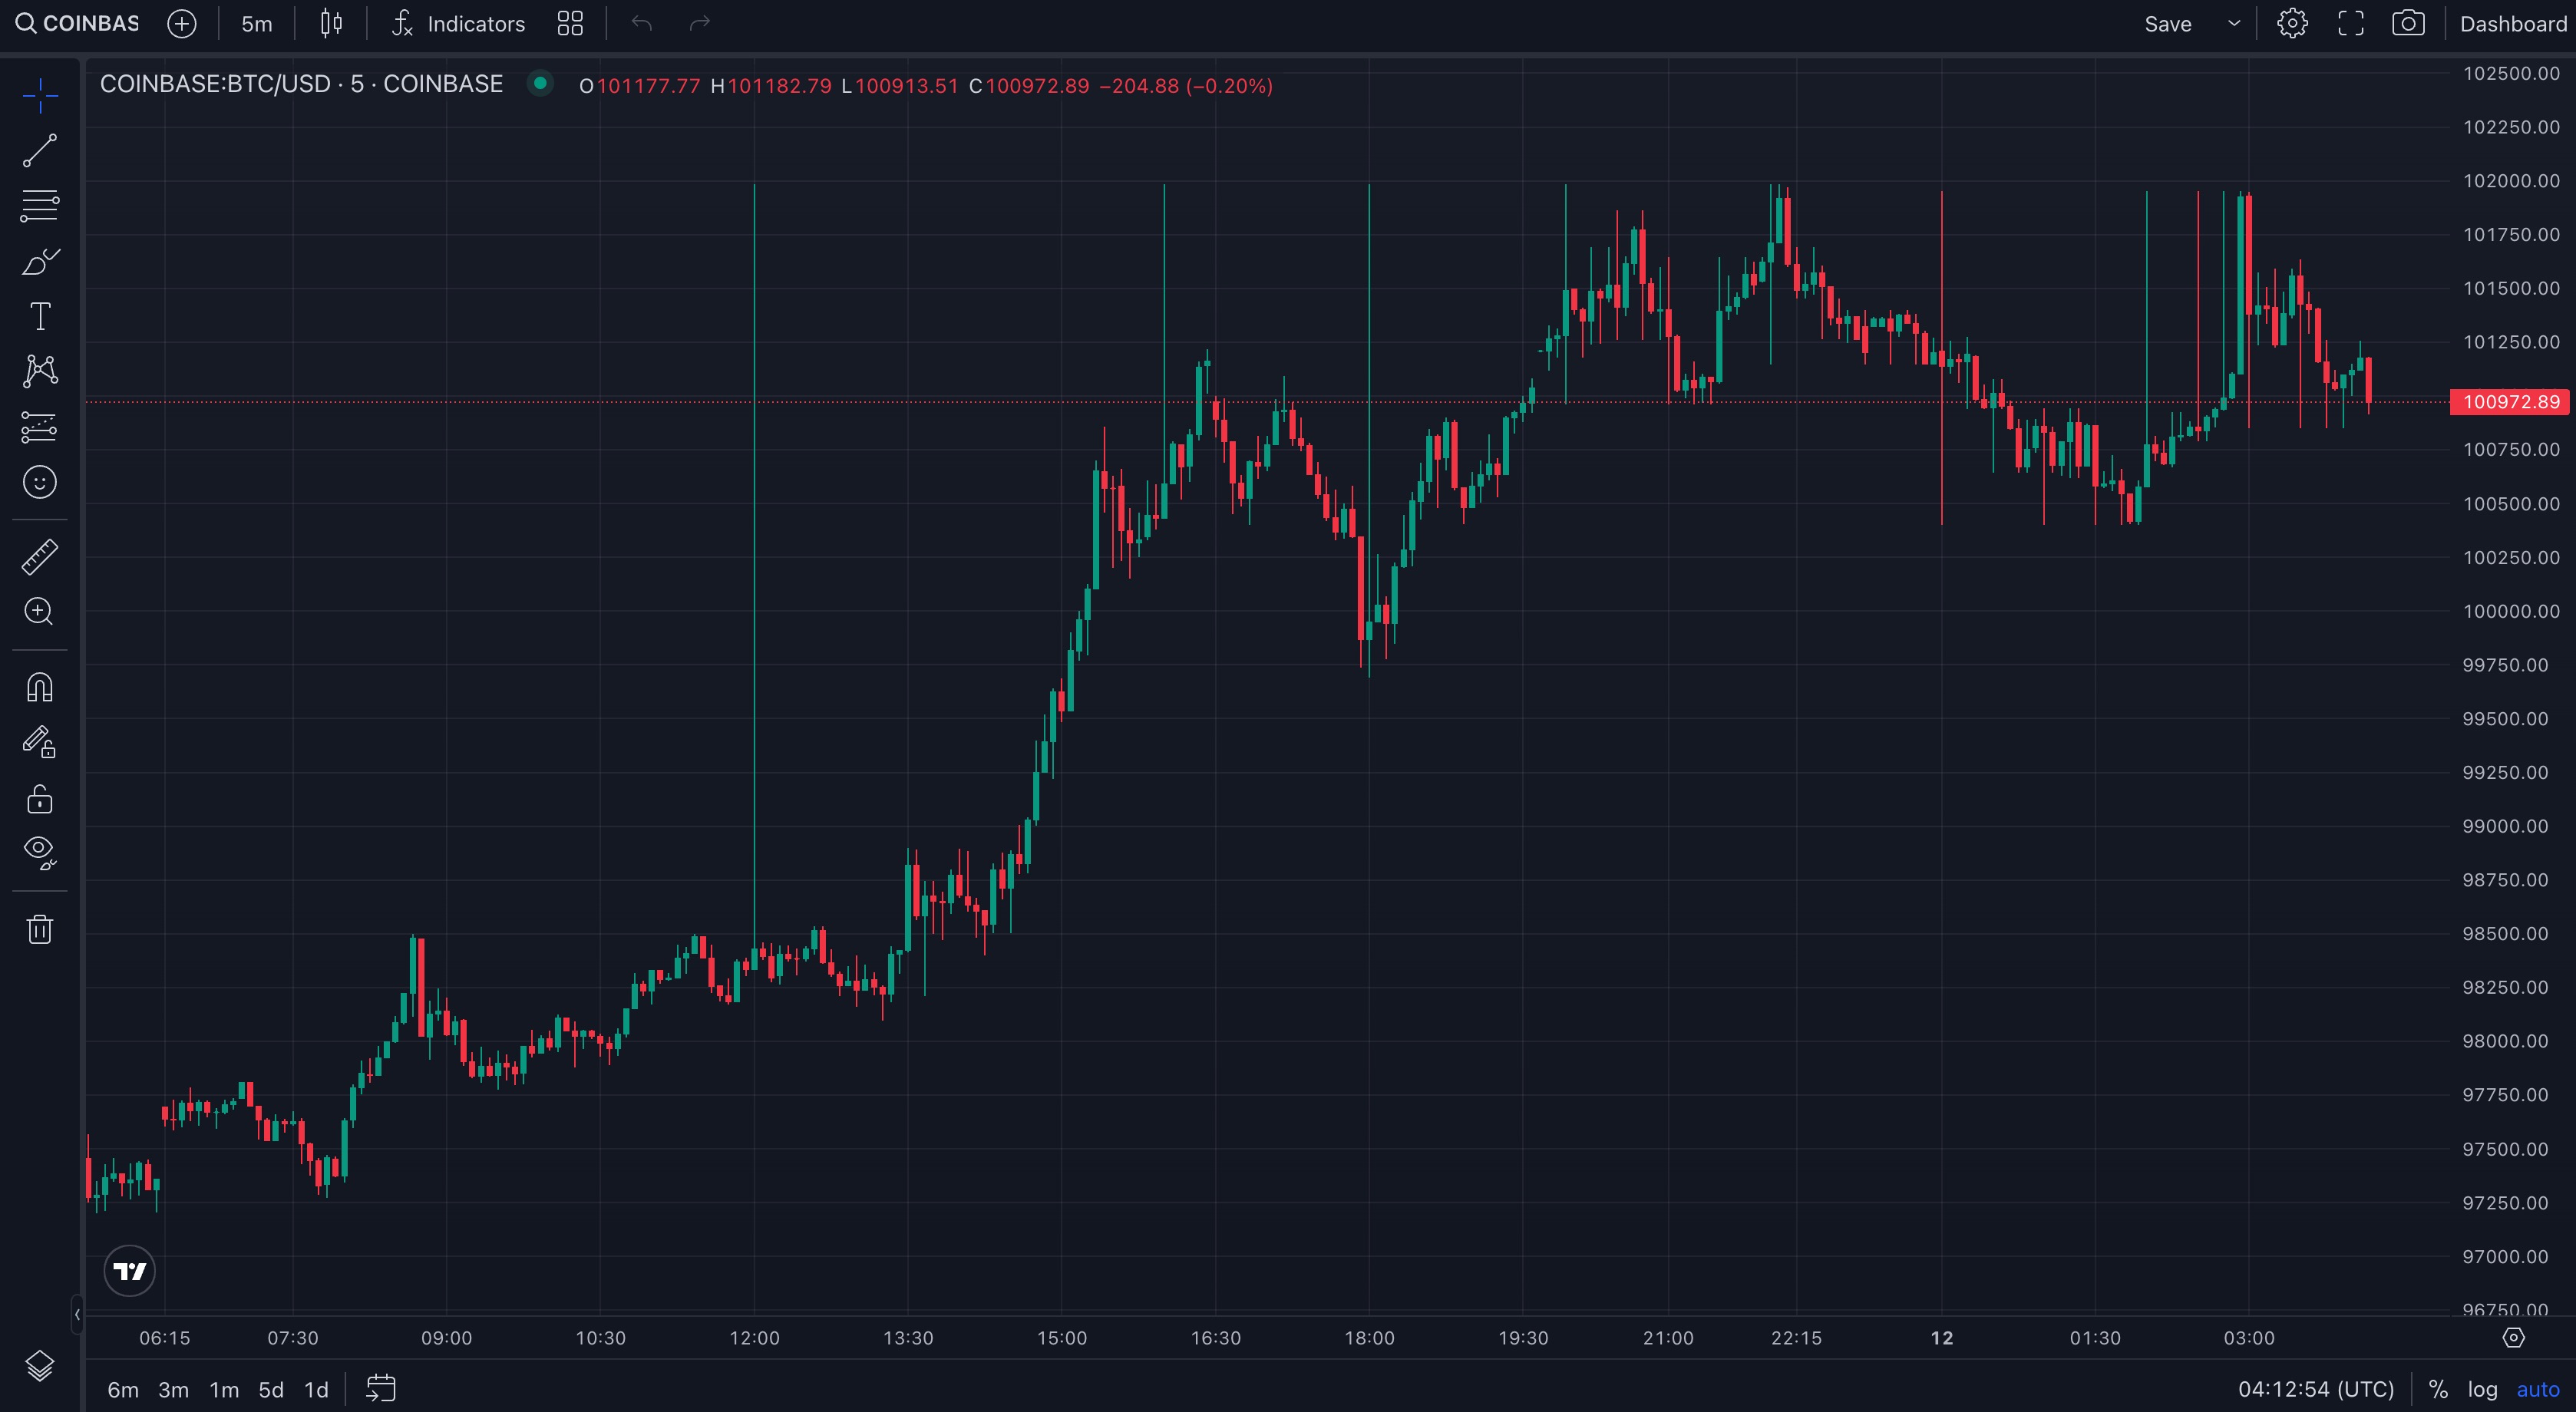
I've been mostly exploring how to optimize the databases we have built and trying to optimize viewing the data. For now, we have moved on from just viewing charts in Grafana and now using the TradingView Charting Library to plot real-time prices.
Dashboard

Thoughts
The TradingView Charting Library does in fact need to be licensed and you can ask the team to provide you a license but your website does have to be live to get a license. You should figure out how to best utilize their license. Now in terms of pulling data to populate the charts, you will have to determine how to query your QuestDb as well as your Redis cache to determine your current timeseries of candlesticks. Once you have that, you just web socket all ticks to the chart and it will automatically determine the next set of candlesticks in real-time.
What's Strange
One thing I do notice about my candlesticks is that they are straight raw from the exchanges and don't have much clean up on them so they may look different from what you see on the exchange. One can argue whether that is correct or not but each liquidity provider has a different feed so they will be different. TastyTrade actually uses DXFeed for their market feed which I love that they provide that for people like me. We can get real-time data without having to pay for a real-time feed. It's not much more but if you were a big company doing this, you'd be paying a lot of money for it.
