Grafana
Installation
Kubernetes Metrics
Add Data Connector
In Grafana, go to Connections > Add new connection. Search for Prometheus and select it.
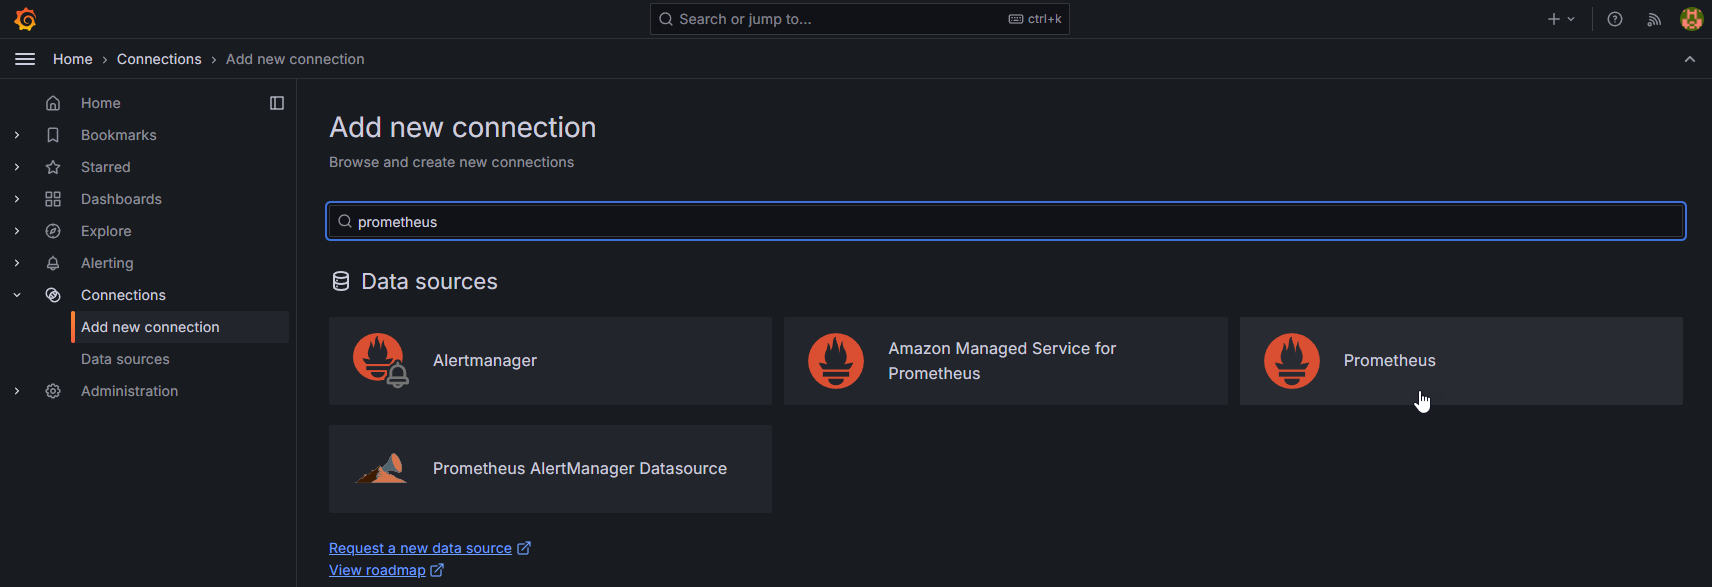
Add the Prometheus Source

Configure the address. It should be the Kubernetes Server address with port 30002 if you configured the service previously.
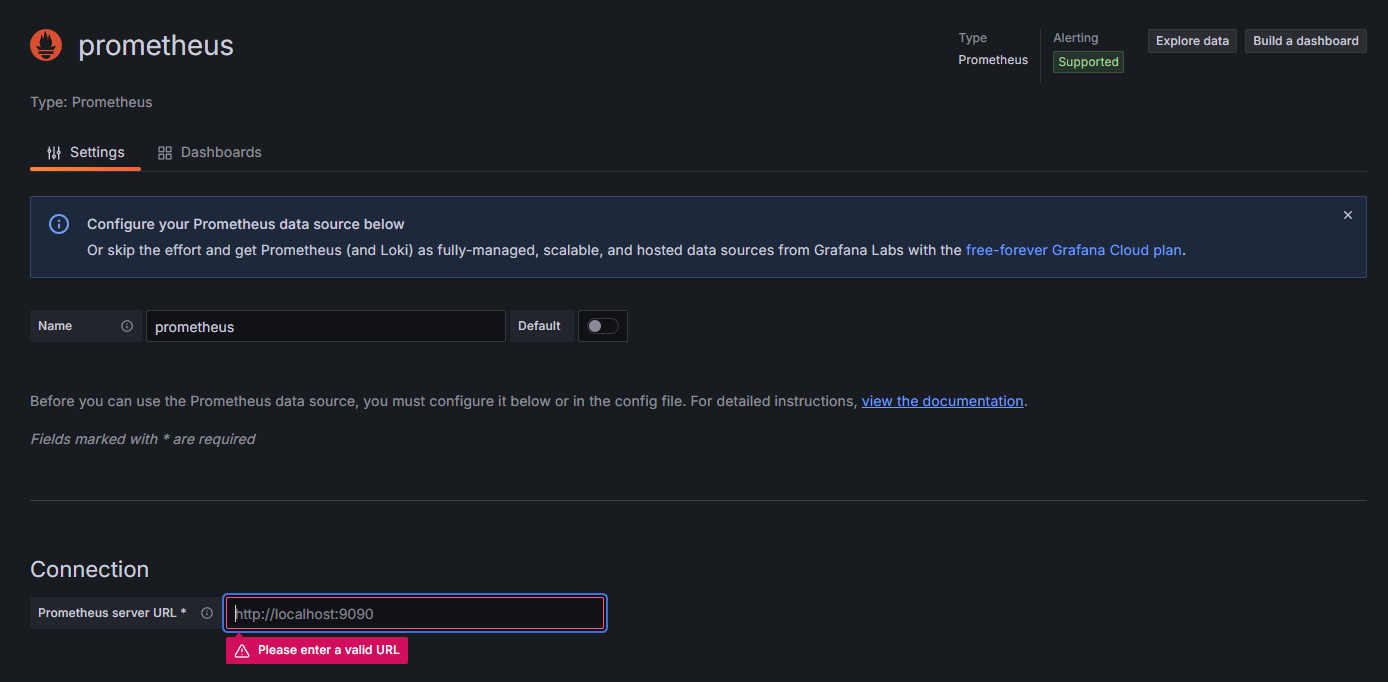
Configure Dashboard
- Grafana K3s Dashboard
- Dashboard Id: 15282
Go to Dashboards > Select Import

Import the Dashboard ID and select 'Load'
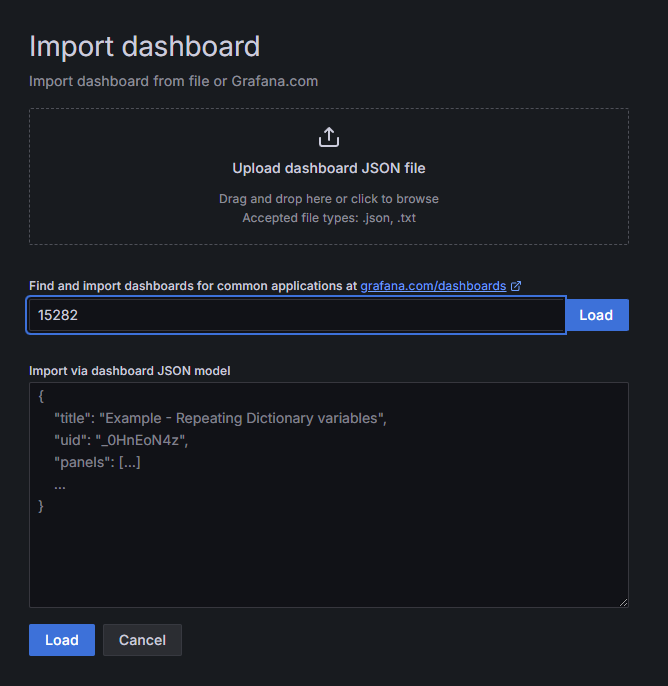
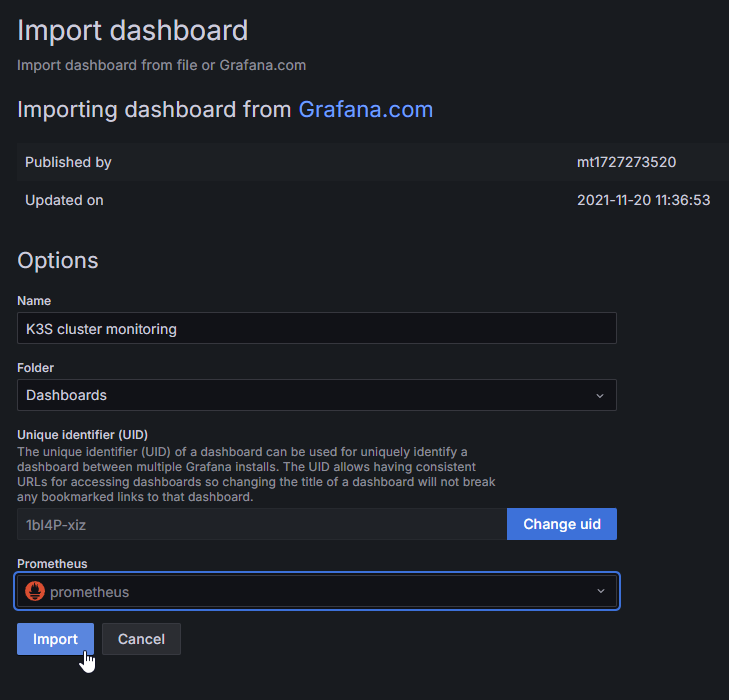
Select the Prometheus Datasource and select 'Import'
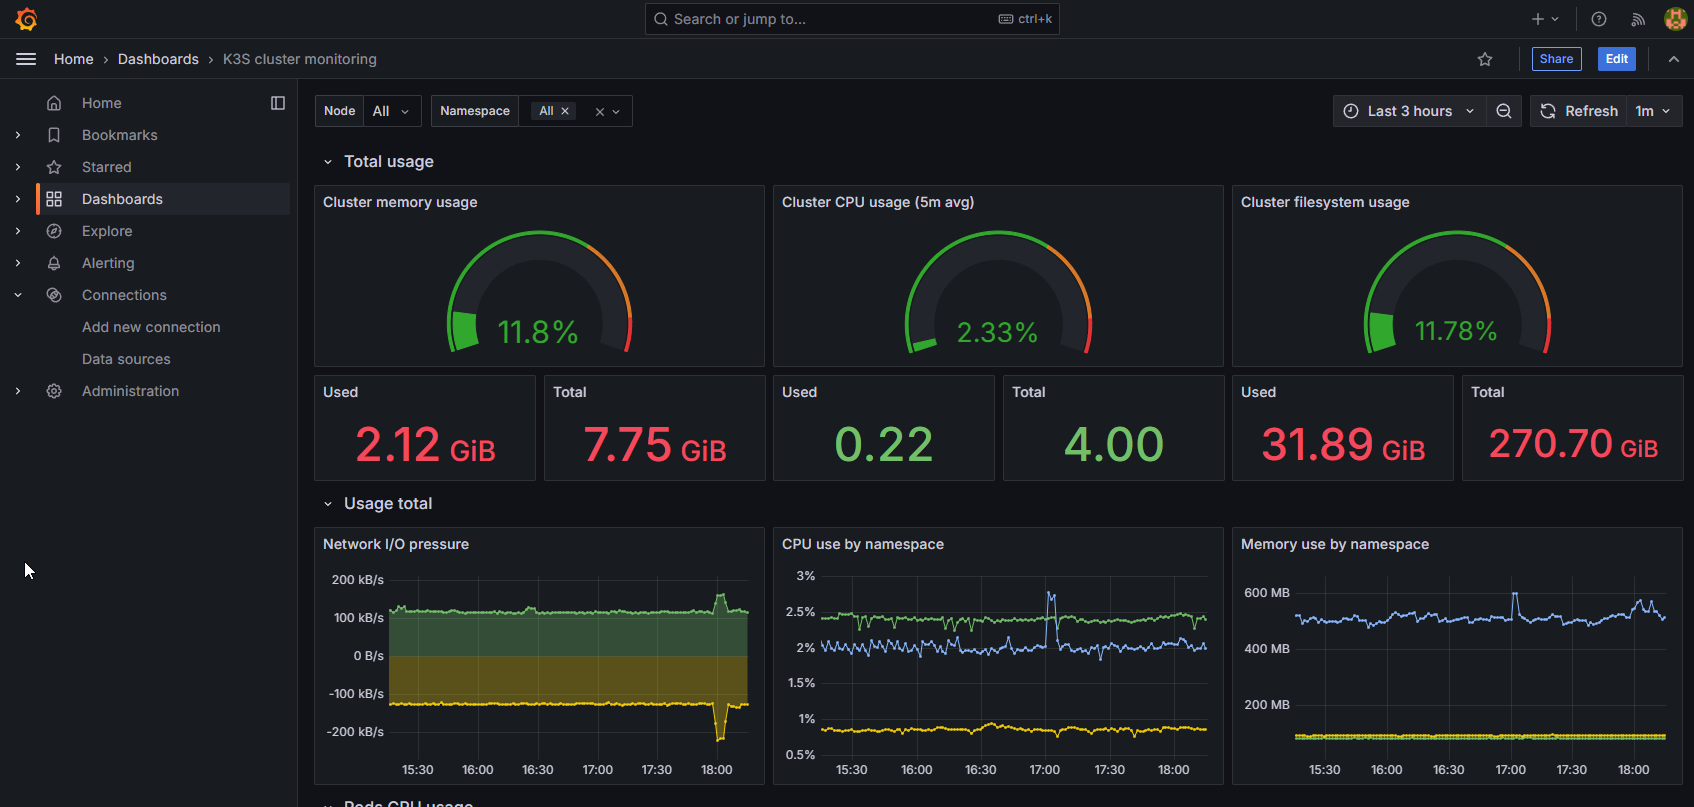
Kubernetes metrics should now show up
