Open Lens
Most people when starting with Kubernetes will begin by installed Kubernetes and accessing it's command via KubeCtl. When learning Kubernetes, it's helpful to understand it's inner workings but as you progress, having a UI to manage your deployments is extremely helpful. For managing multiple Kubernetes clusters, I recommend using Open Lens. It's an open source iteration that spawned K8sLens from K8slens.dev. Depending on your needs, you may need K8sLens, it has some nice features liking being able to view logs easily in individual containers. Is it necessary? No but it's a nice feature that may save you time. For myself, I only use the free version via Open Lens.
Configuration Files
Remember the configuration *.yaml files we pulled from the k3s servers? Those should be sitting in your ~/.kube folder. Before we begin, open these files and edit them. OpenLens has an issue with how it's configured so we need to modify a line.
Change the line:
context: []
To
contexts:
- context:
    cluster: default
    user: default
  name: default
Save the file and open OpenLens.
Cluster Configuration
In Clusters, you should now see your clusters.

Select the right vertical three dots and go to Settings.

Rename your cluster

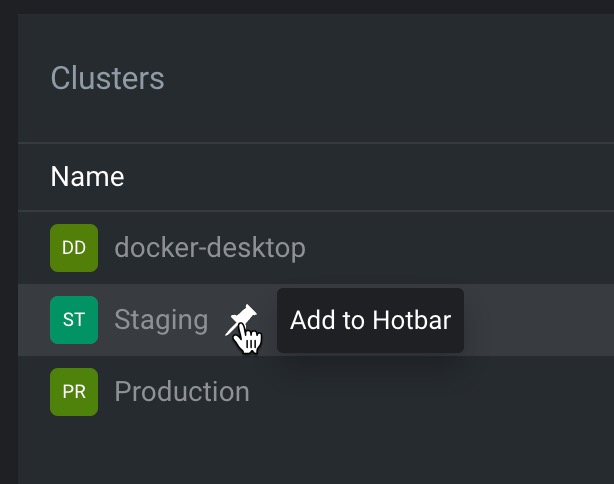
Add your cluster to the Hotbar
Prometheus Metrics
By default, there is nothing in the cluster to show metrics.
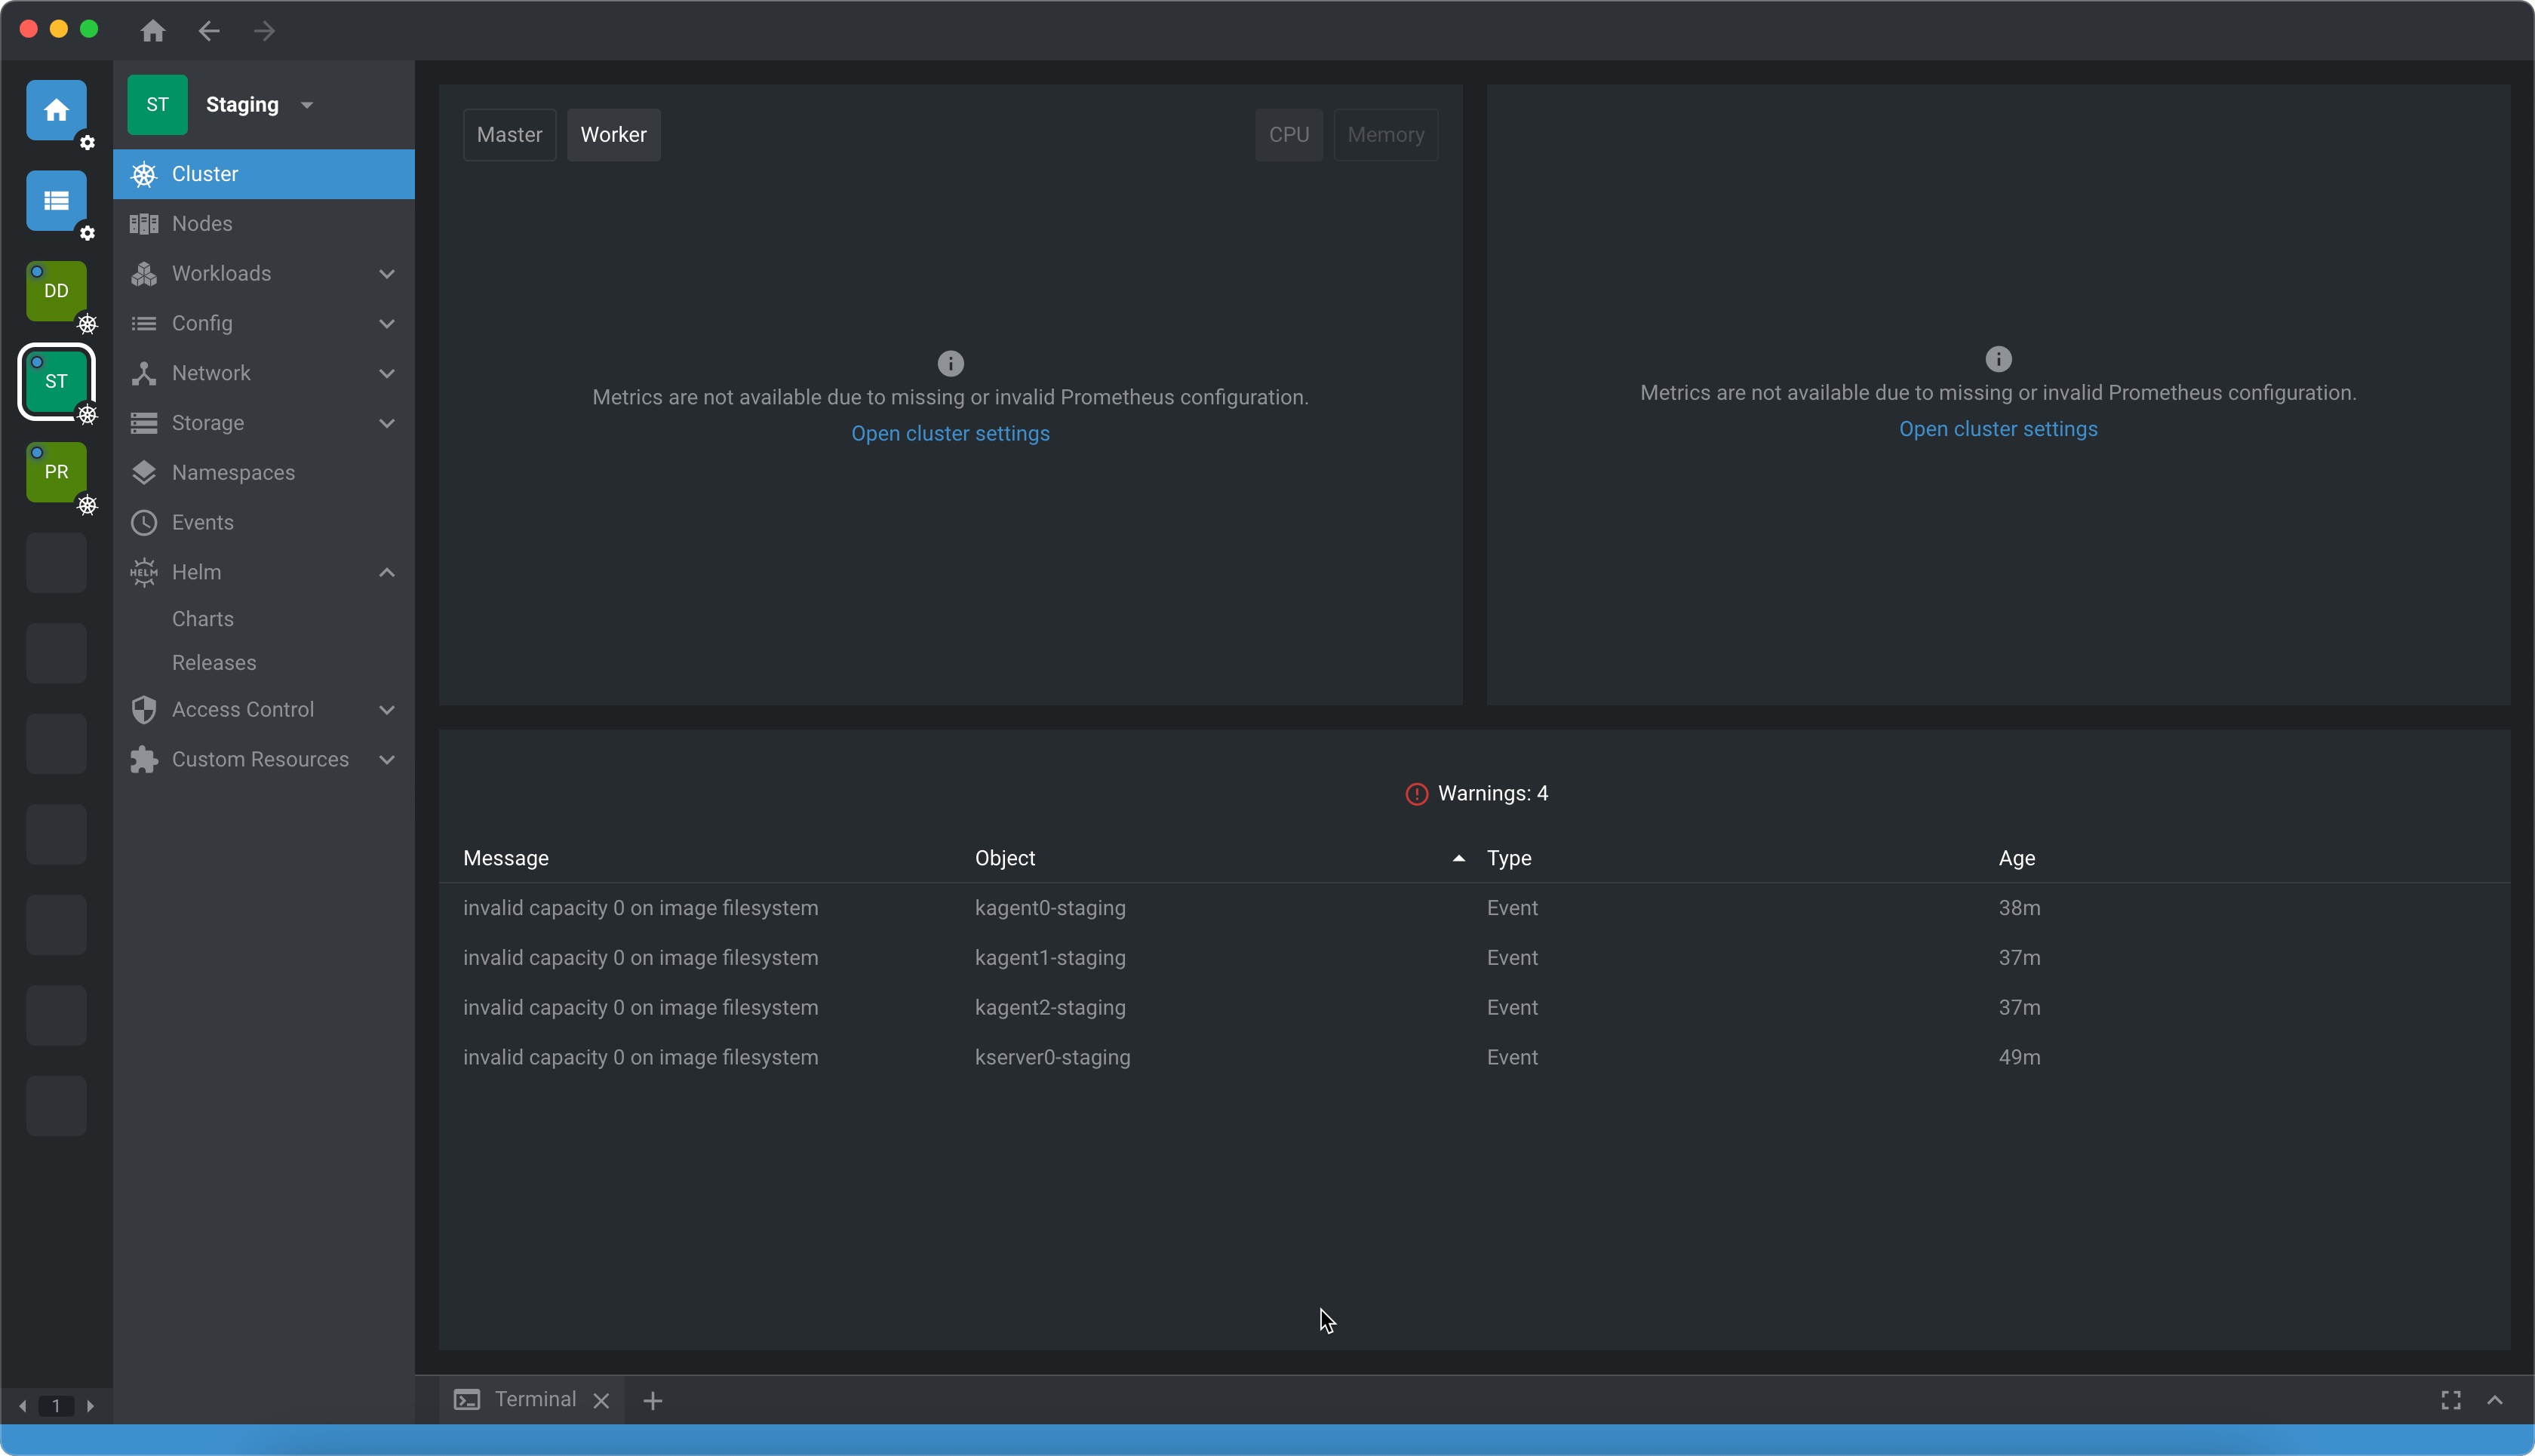
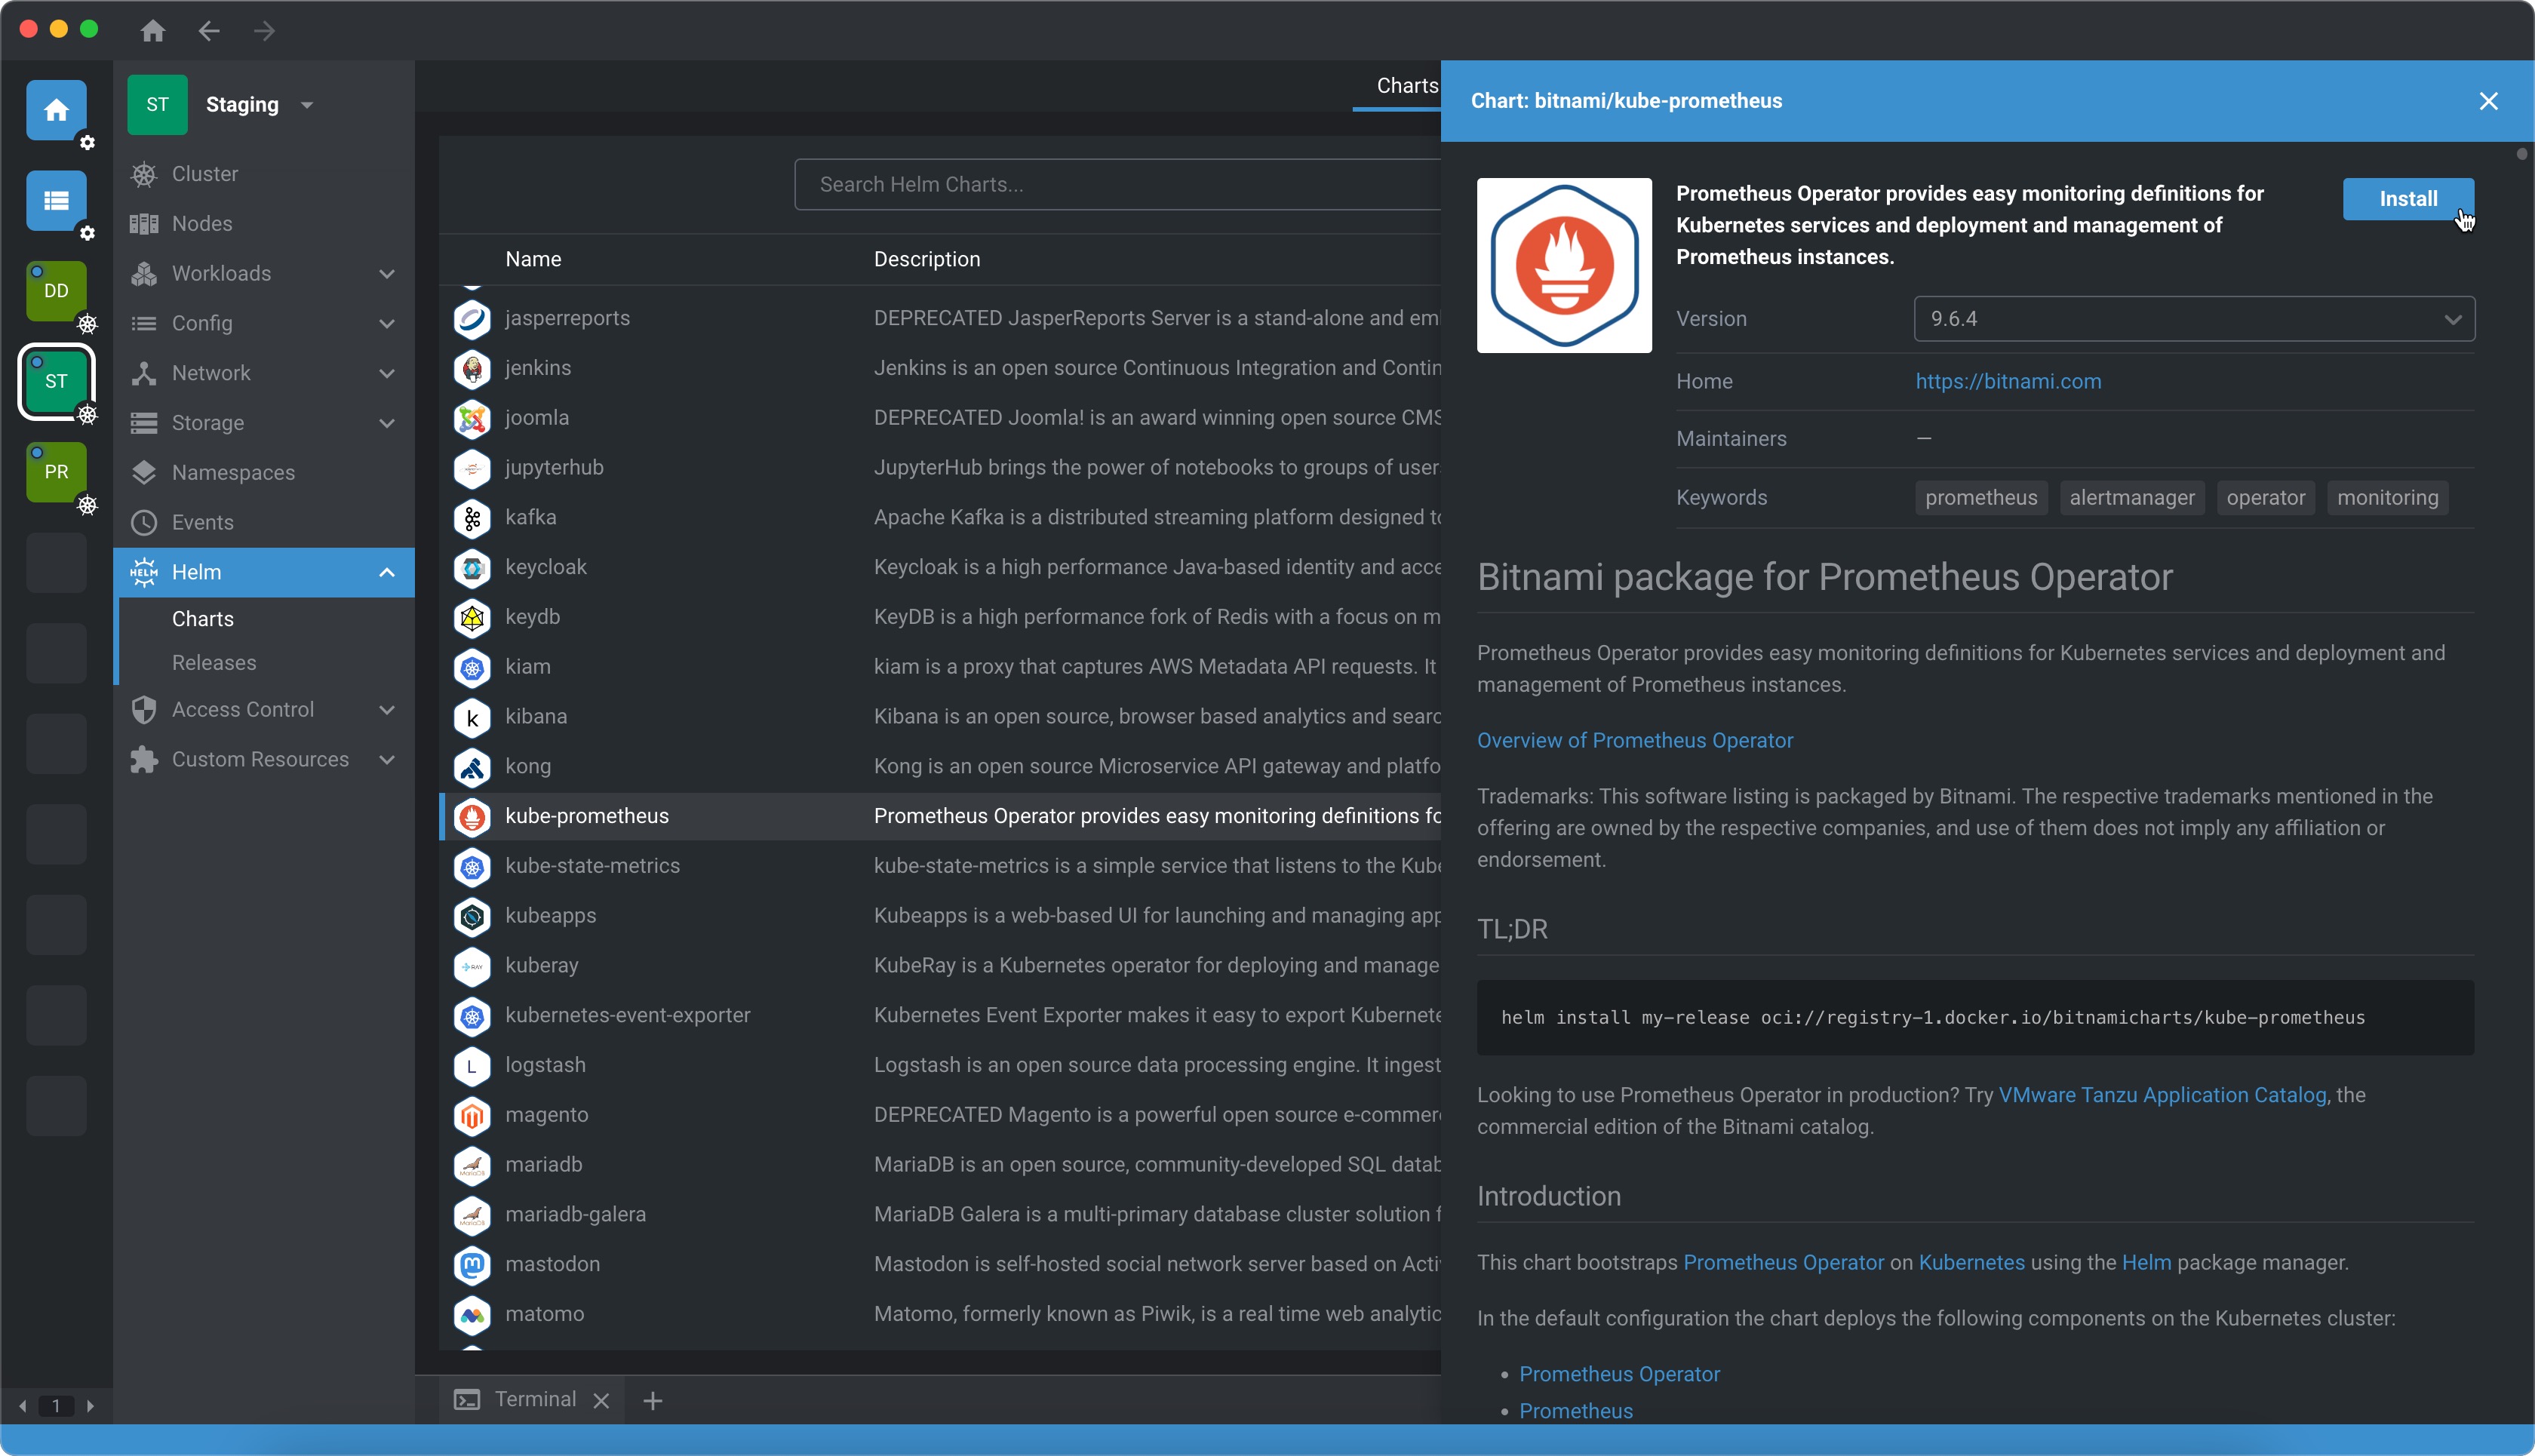
Go to Helm > Chart > Search for Prometheus and select Install
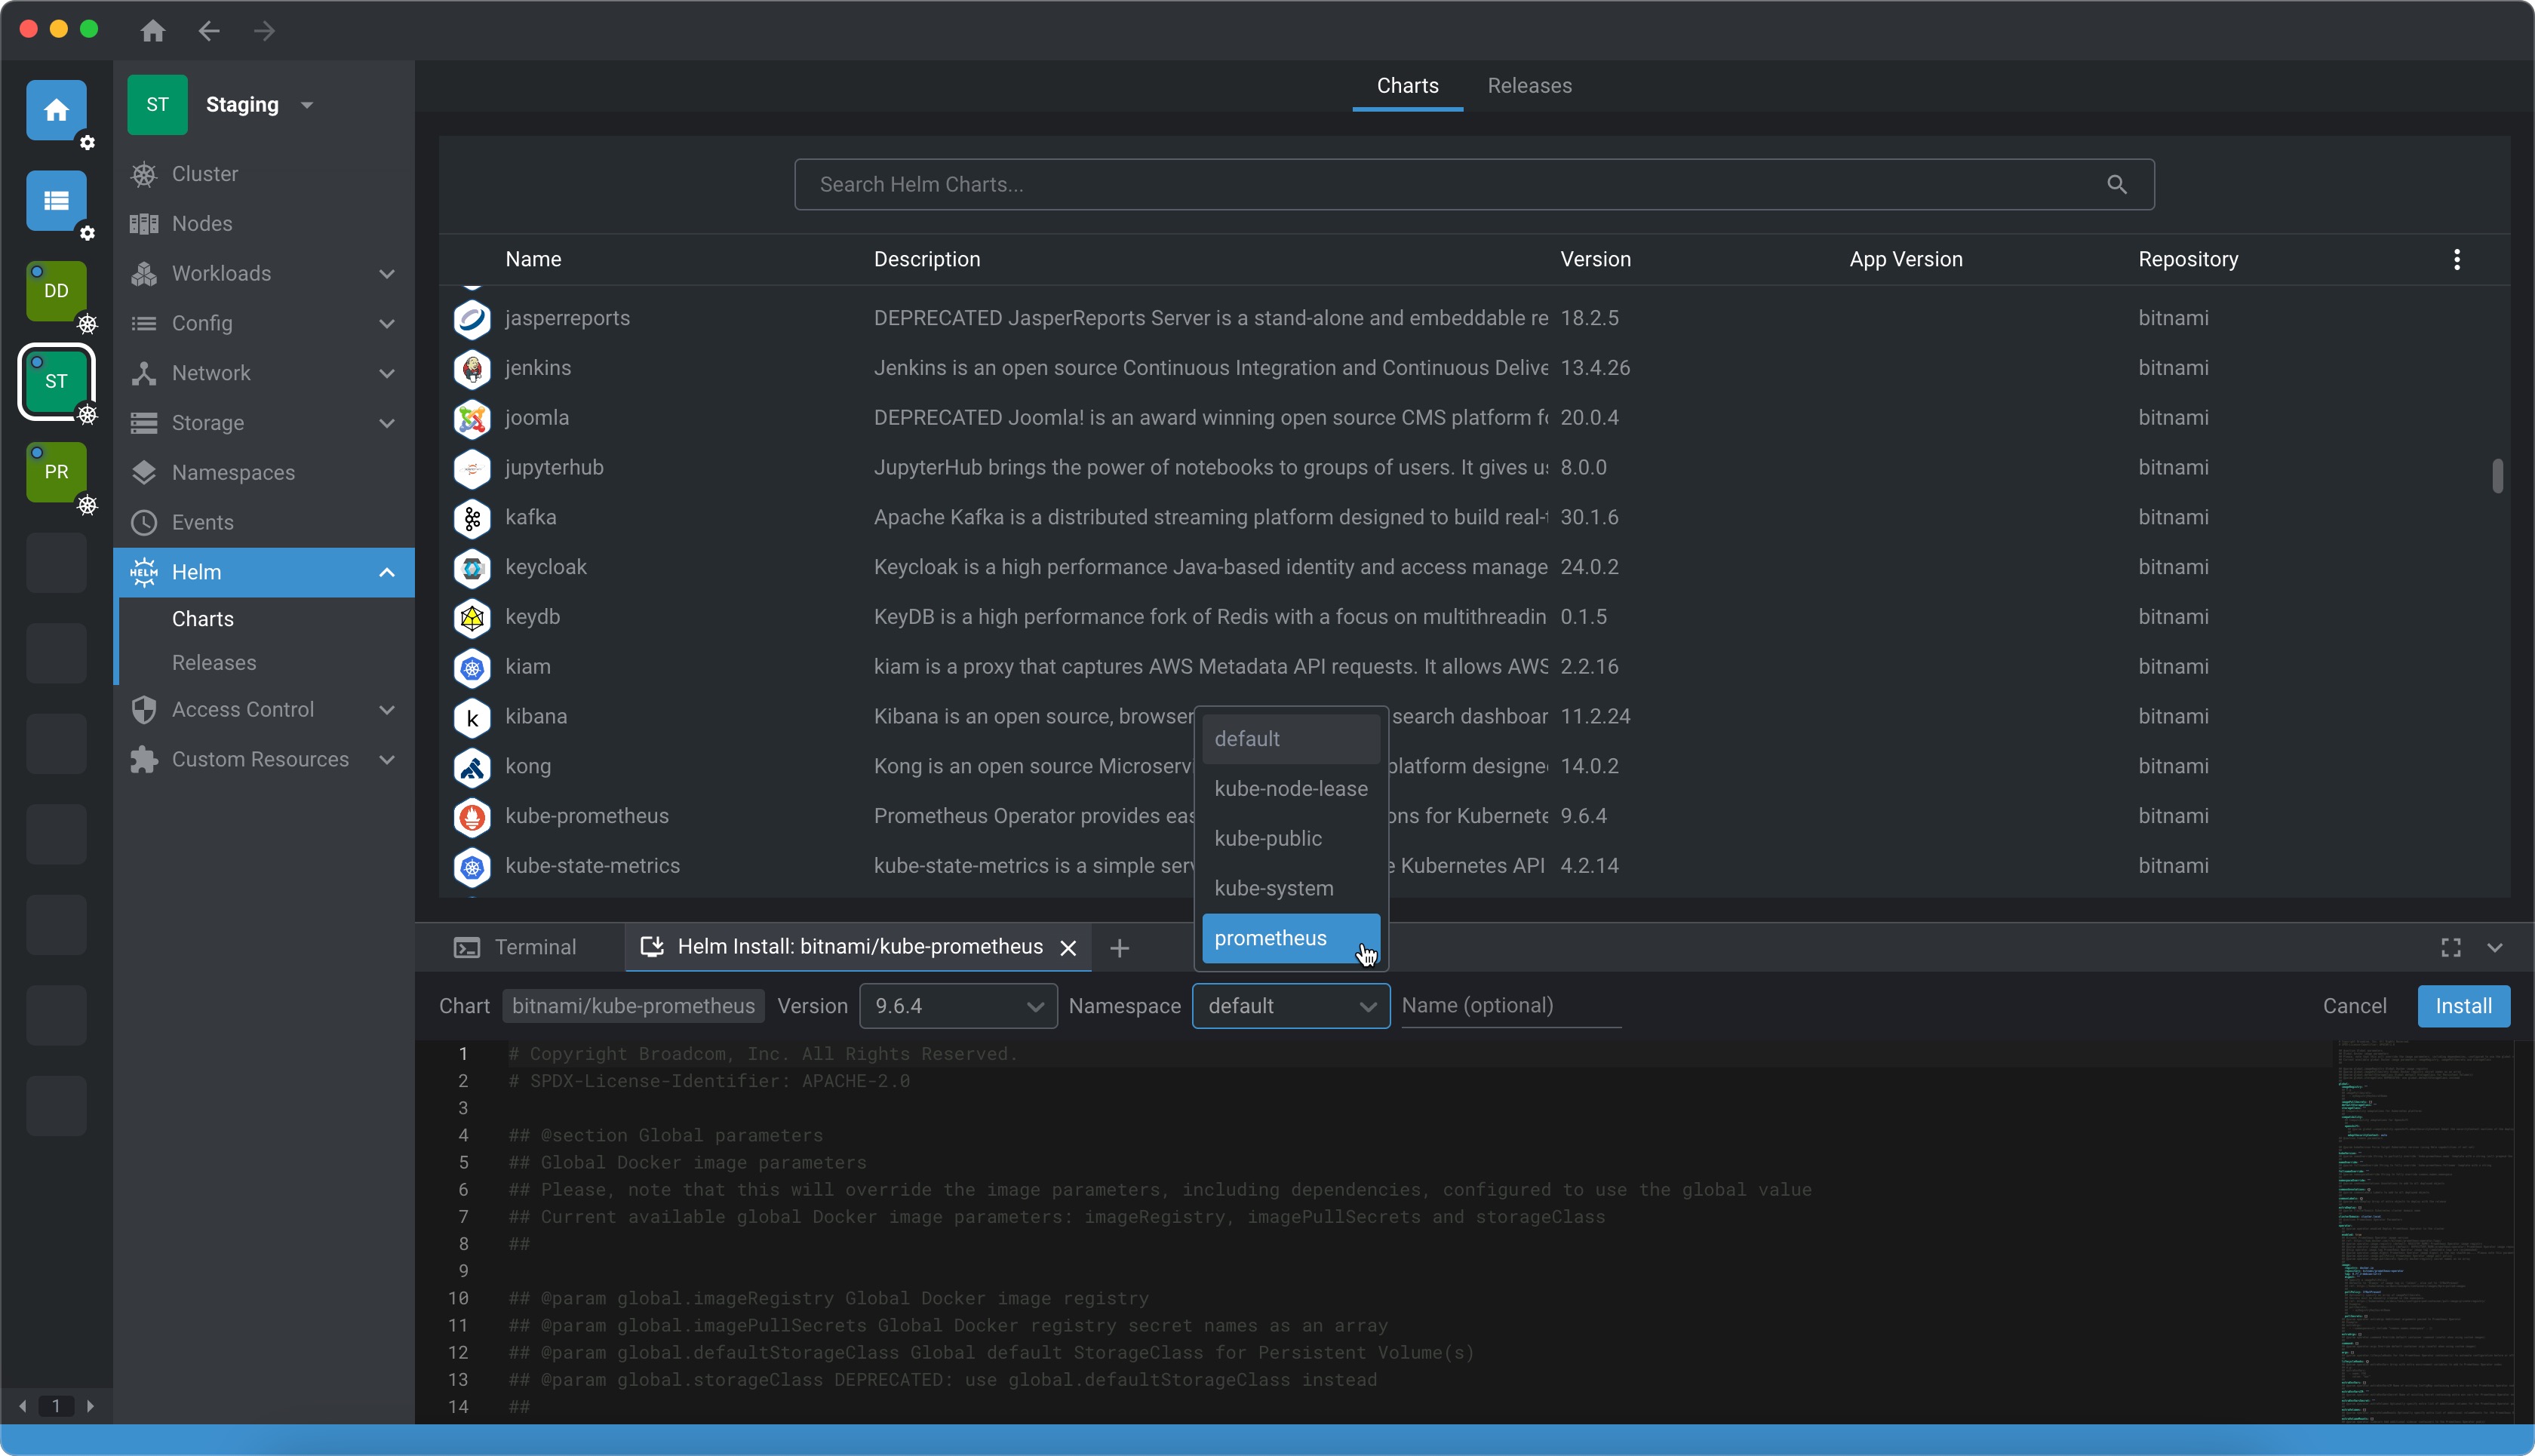
Before you install, change the namespace to Prometheus before selecting Install.
After some time, about 5 minutes, you should start to see metrics in Cluster.
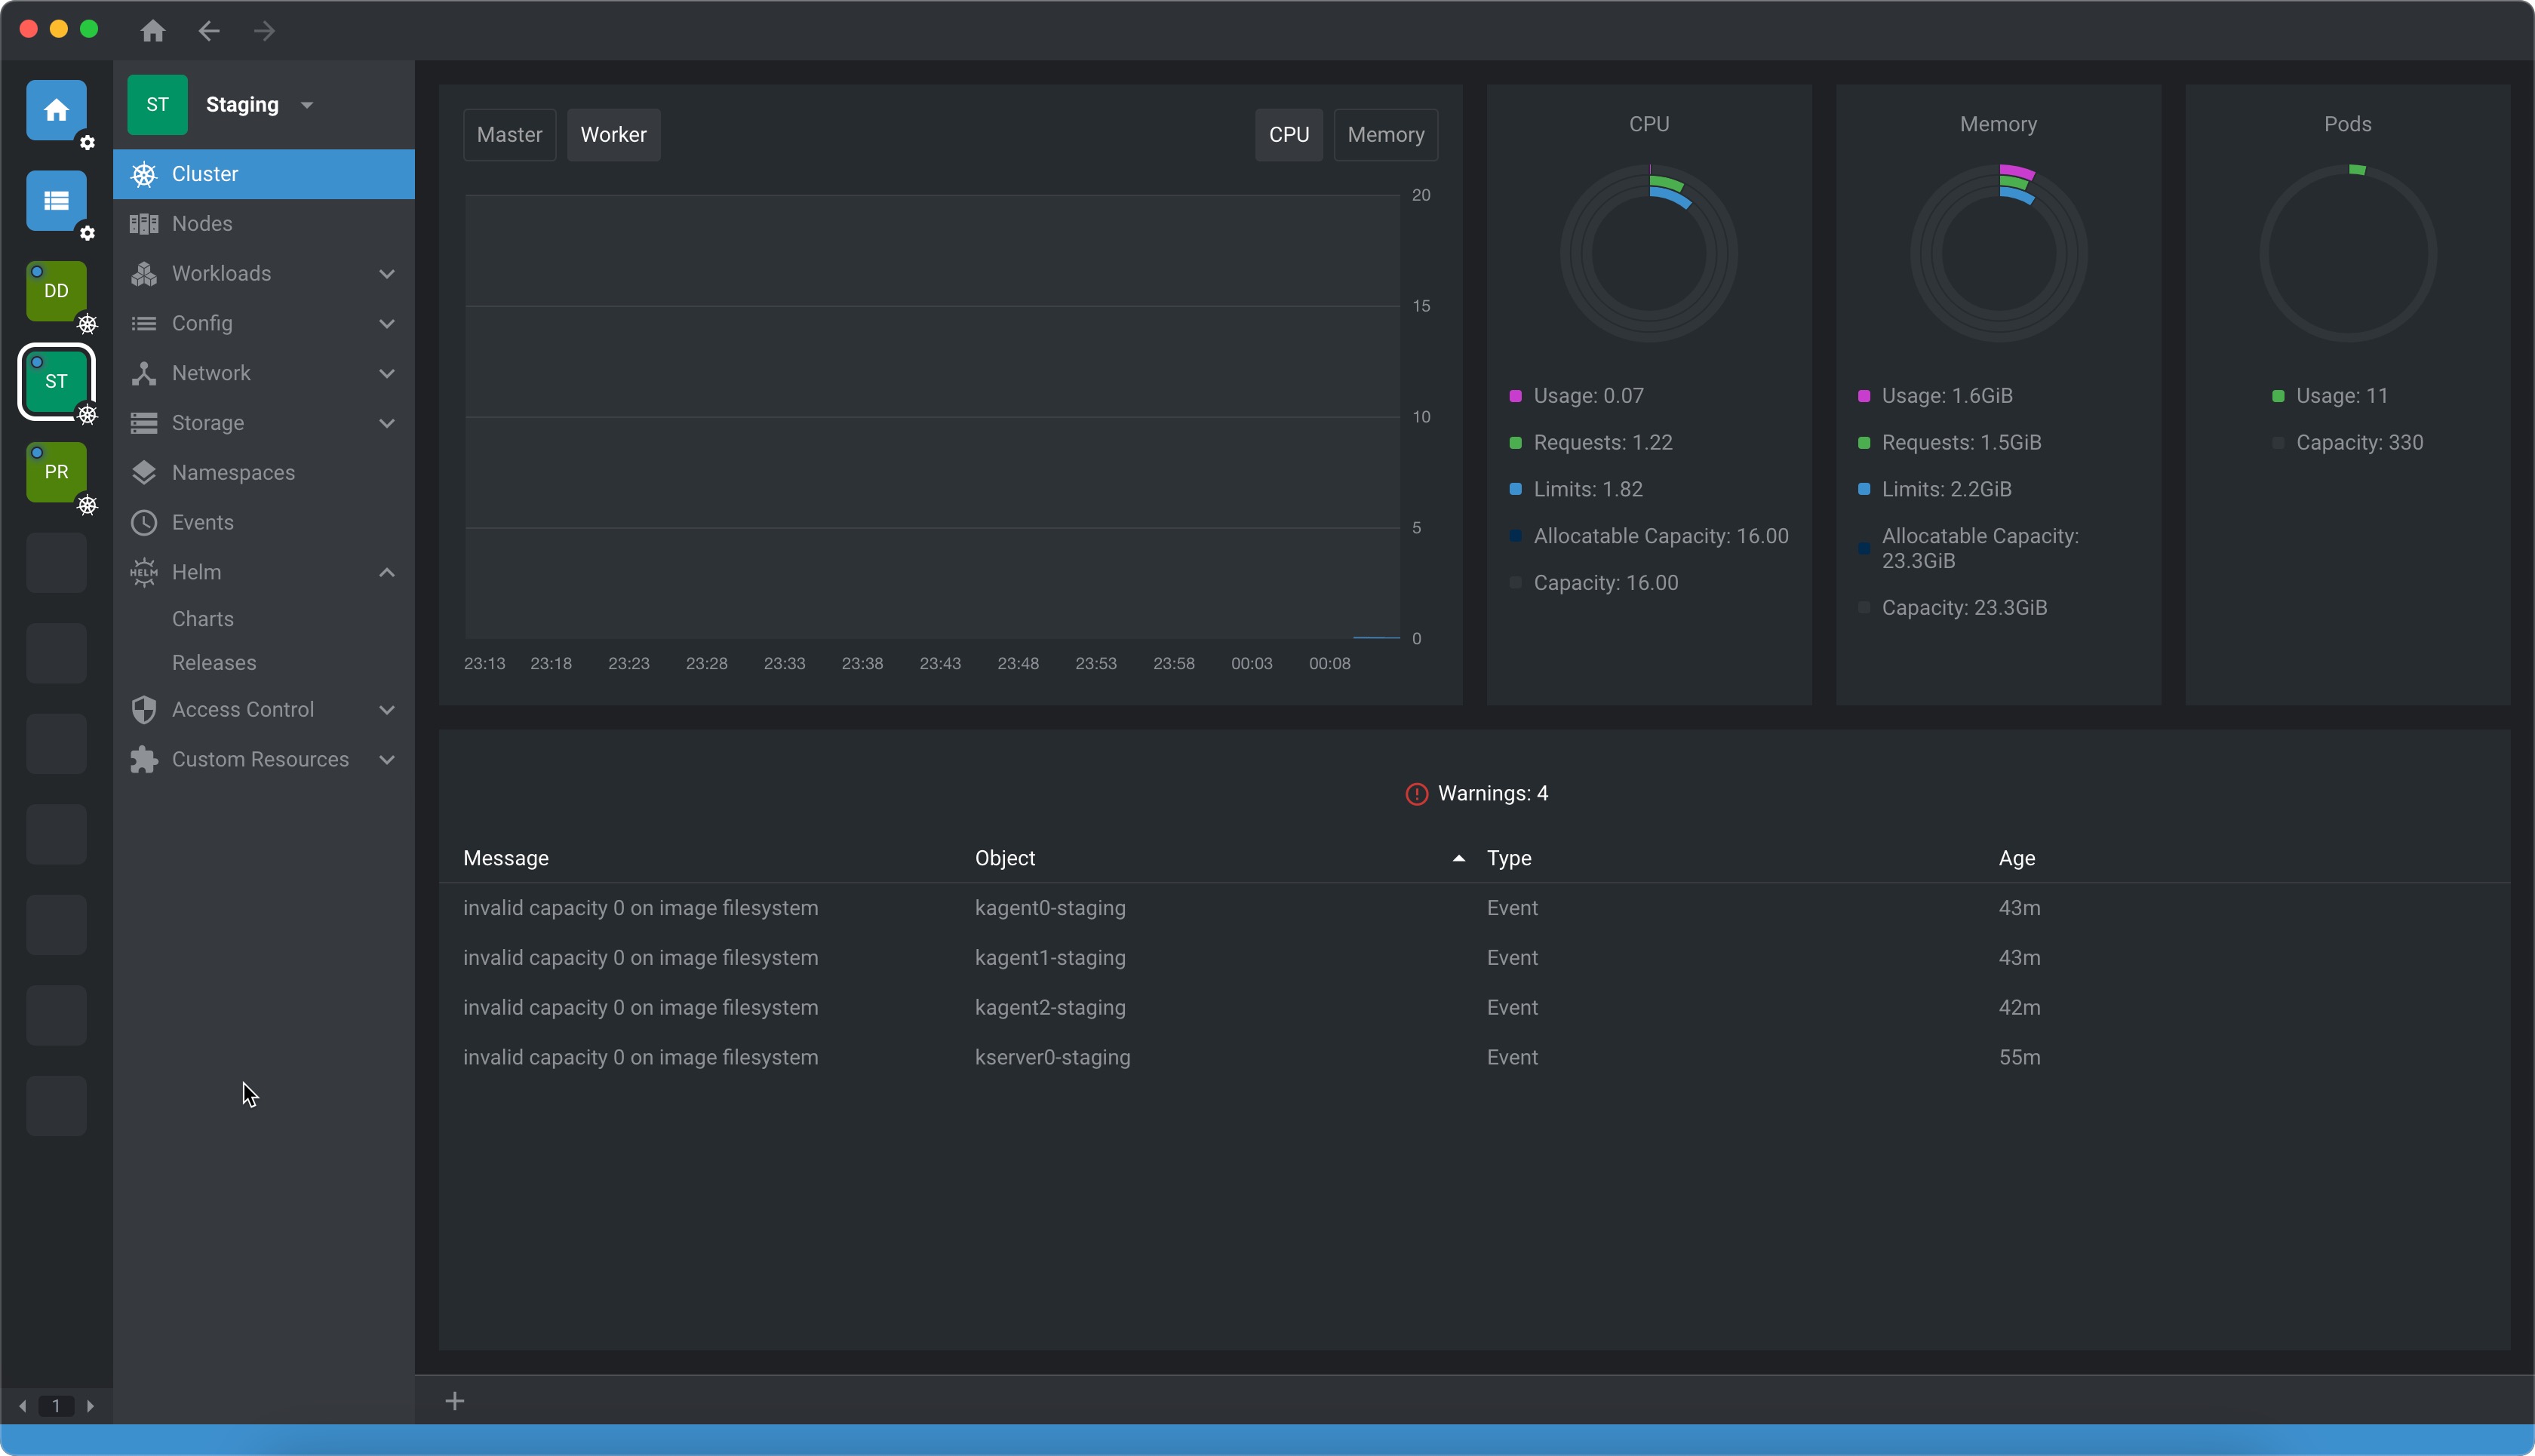
Even though it's nice to see the metrics on OpenLens, it's also very useful to see metrics via Grafana. To do this, we must expose the prometheus service port. Go to Services and select Prometheus as the namespace. Search for the service that has the port setting as 9090/TCP.
Edit the service to use NodePort and set the nodePort to 30002.
spec:
  ports:
    - name: http
      protocol: TCP
      port: 9090
      targetPort: 9090
      nodePort: 30002
  selector:
    app.kubernetes.io/component: prometheus
    app.kubernetes.io/name: prometheus
    prometheus: kube-prometheus-1729829317-prometheus
  clusterIP: 10.43.109.78
  clusterIPs:
    - 10.43.109.78
  type: NodePort
  sessionAffinity: None
  externalTrafficPolicy: Cluster
  ipFamilies:
    - IPv4
  ipFamilyPolicy: SingleStack
  internalTrafficPolicy: Cluster